


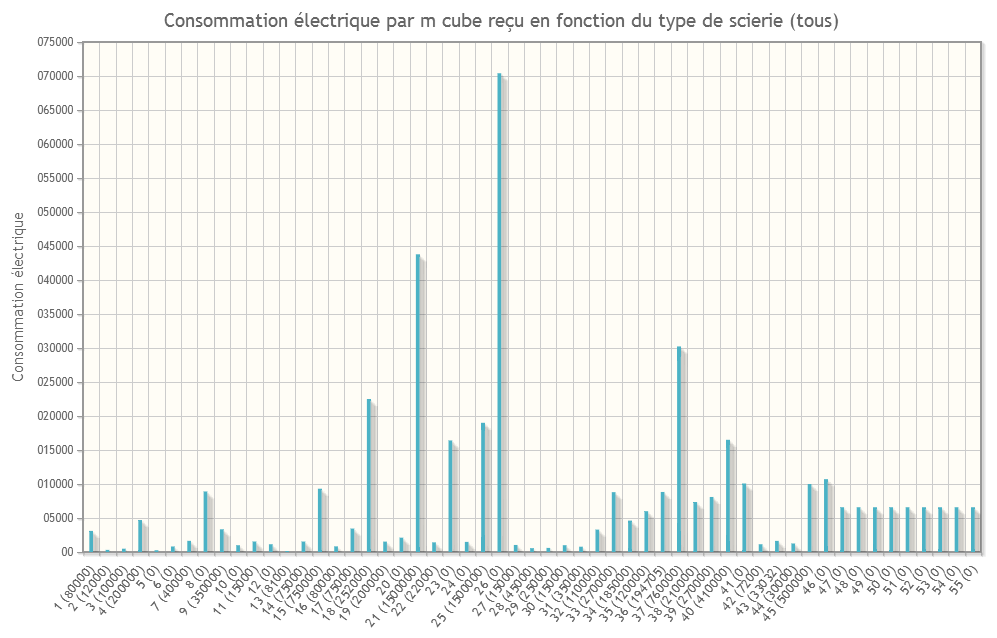
Electricity consumption per m³ of logs received depending on the type of sawmill
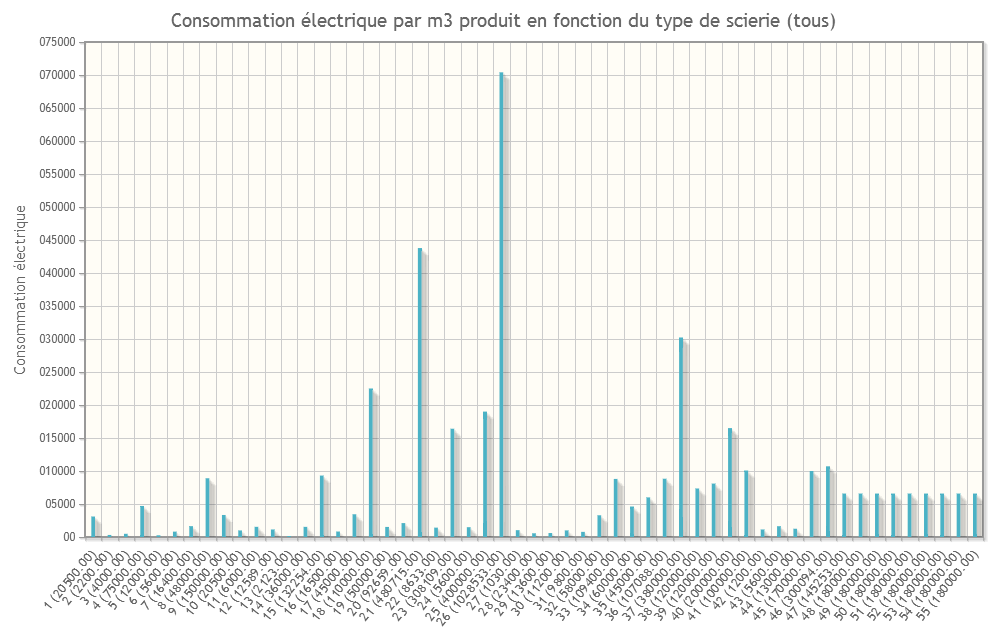
Electricity consumption per m³ of sawnwood depending on the type of sawmill
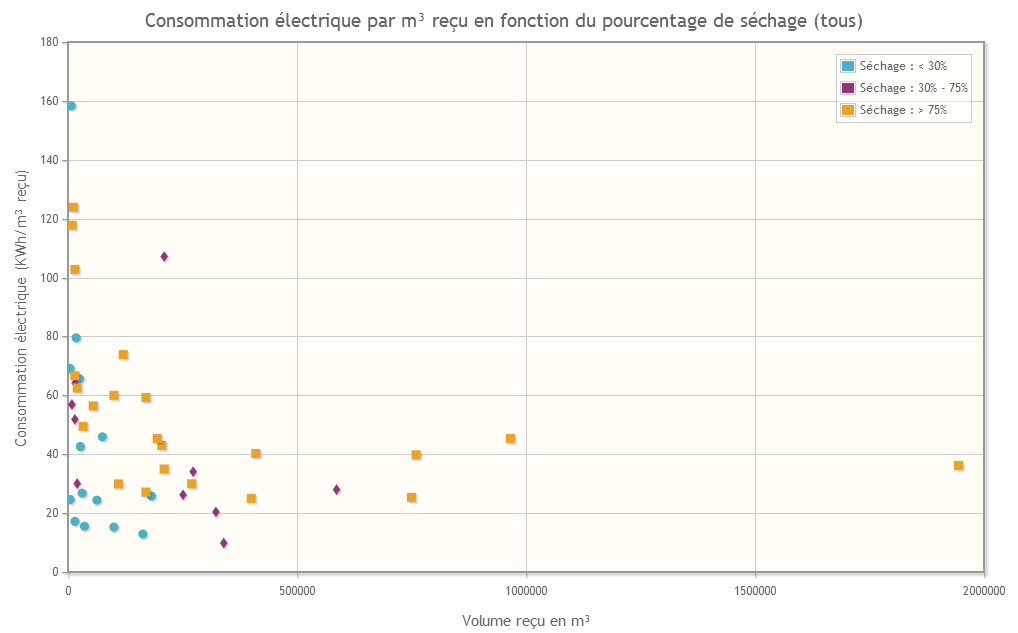
Electricity consumption per m³ of logs received based on the percentage of drying
Total energy consumption (electric + thermal) per m³ of logs recieved depending on the percentage of drying
Electricity consumption per m³ of sawnwood depending on the material yield and percentage of drying
Heat consumption per m3 of log received depending on species
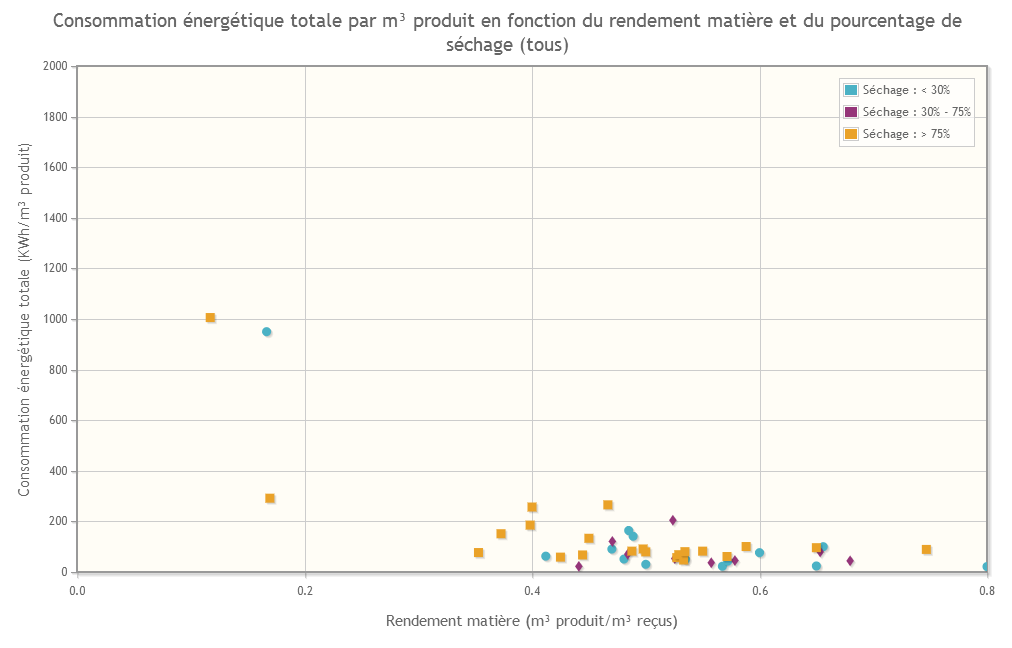
Total energy consumption per m³ of sawnwood depending on the material yield and percentage of drying
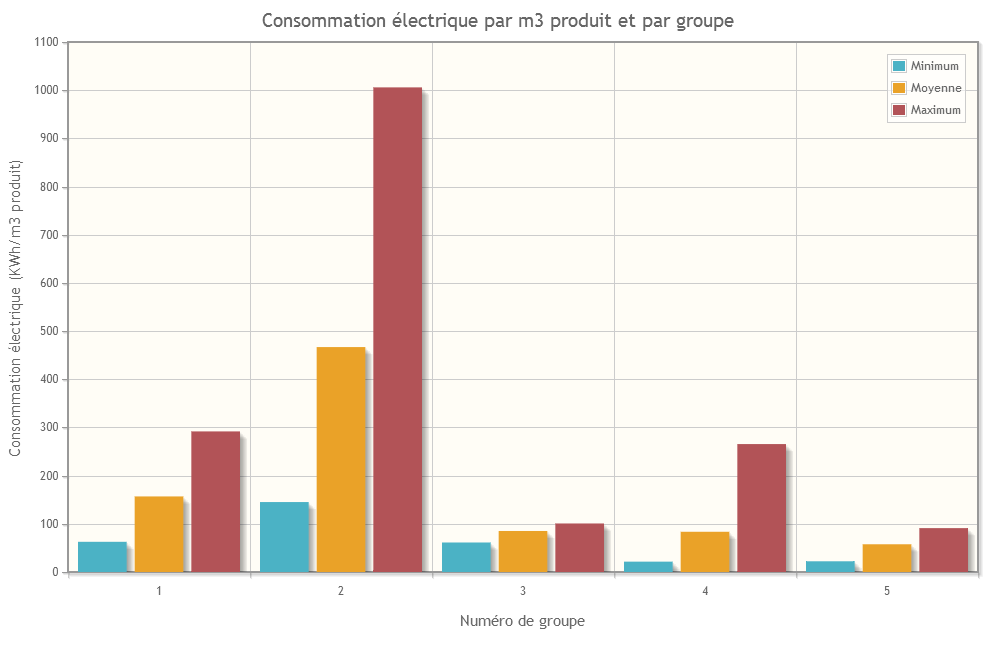
Electricity consumption per m³ of sawnwood and group
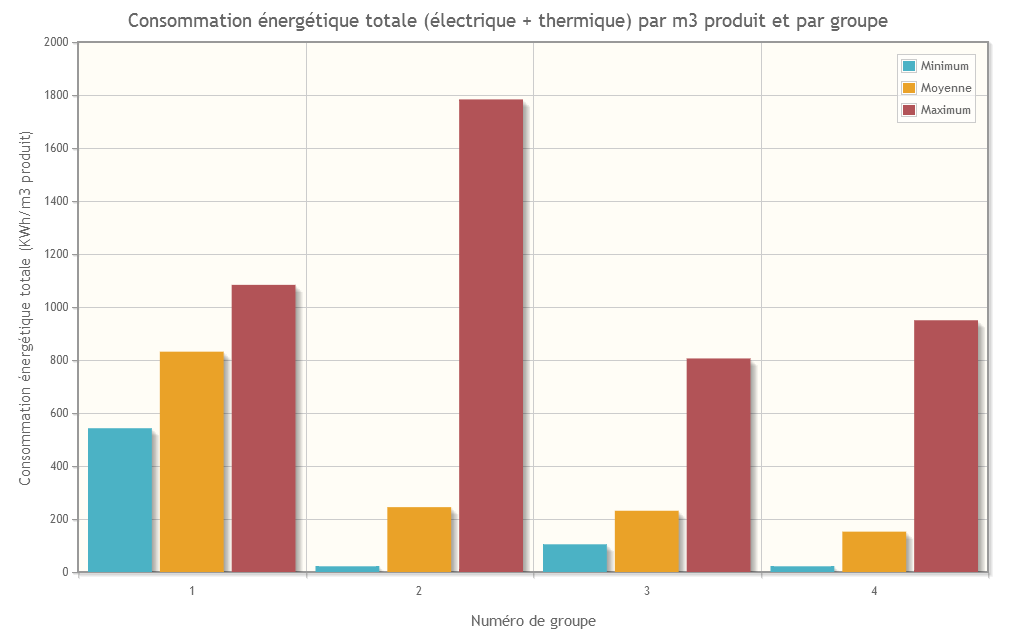
Total energy consumption (electrical + thermal) per m³ of sawnwood and per group
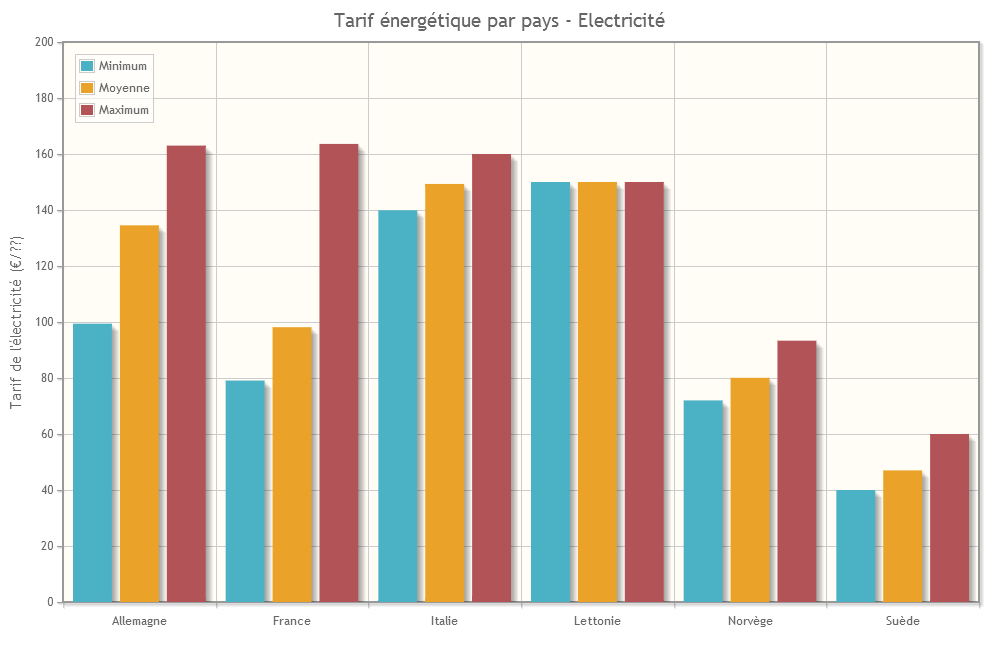
Energy costs by country – Electricity
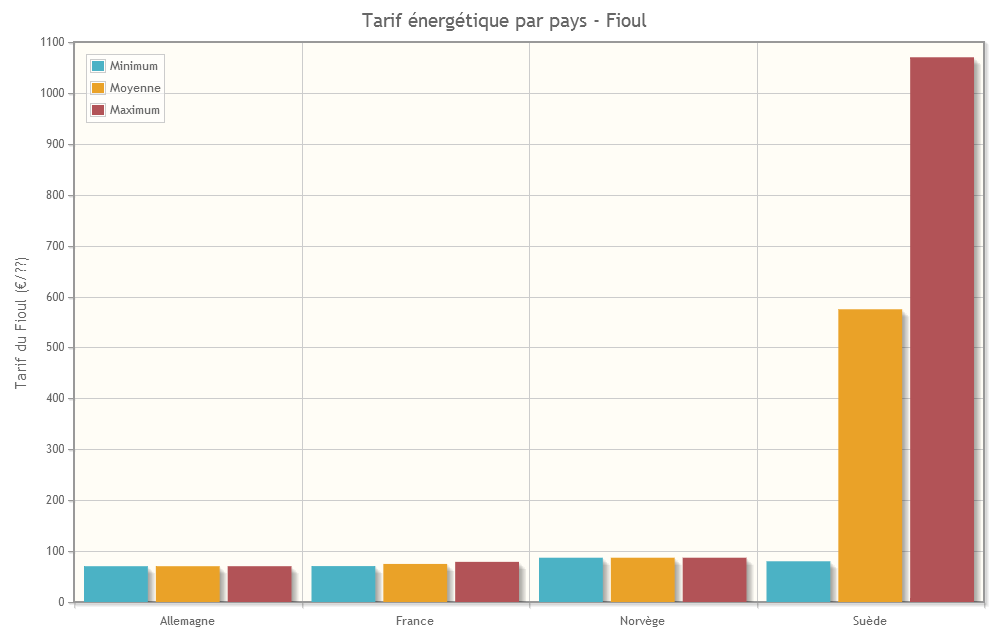
Energy costs by country – Oil
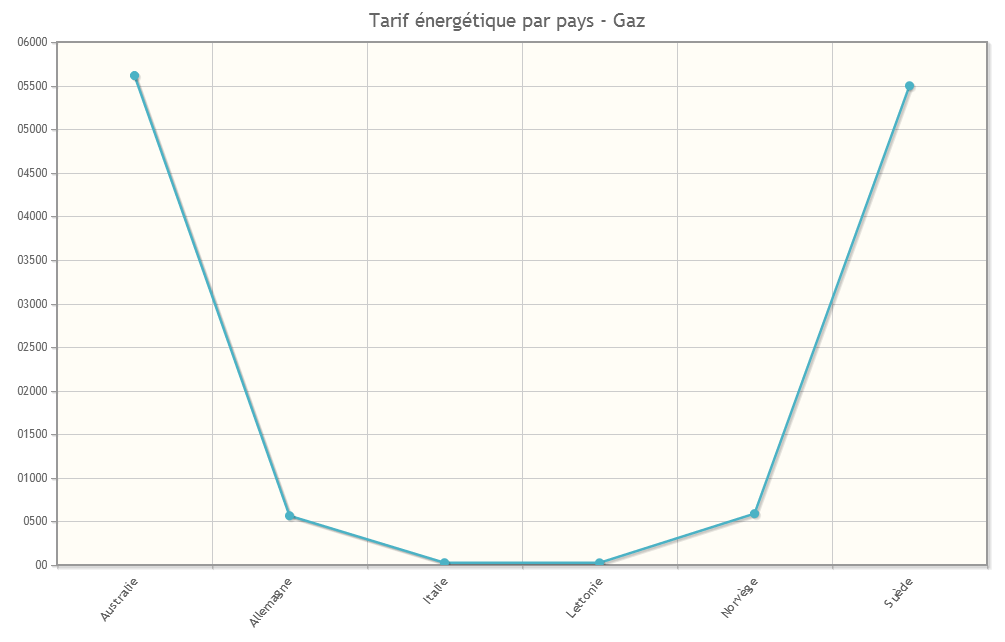
Energy costs by country – Natural Gas
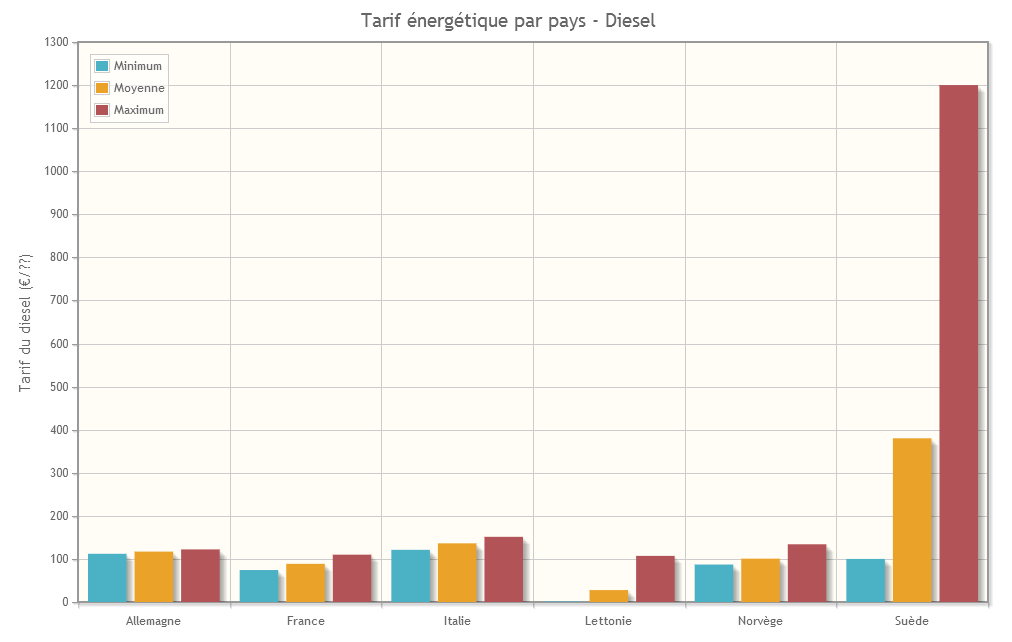
Energy costs by country – diesel
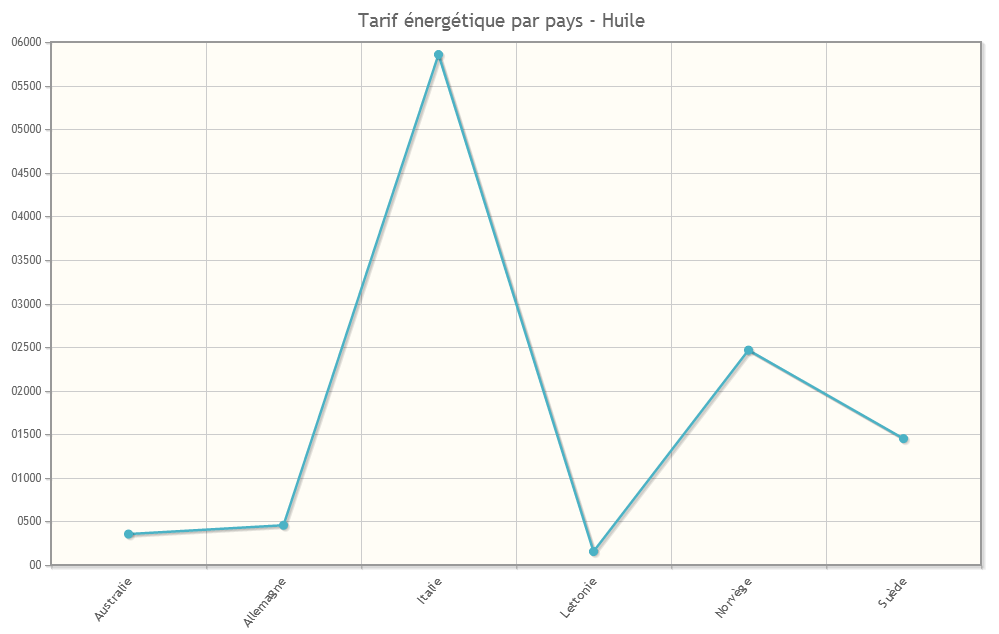
Energy costs by country – oil
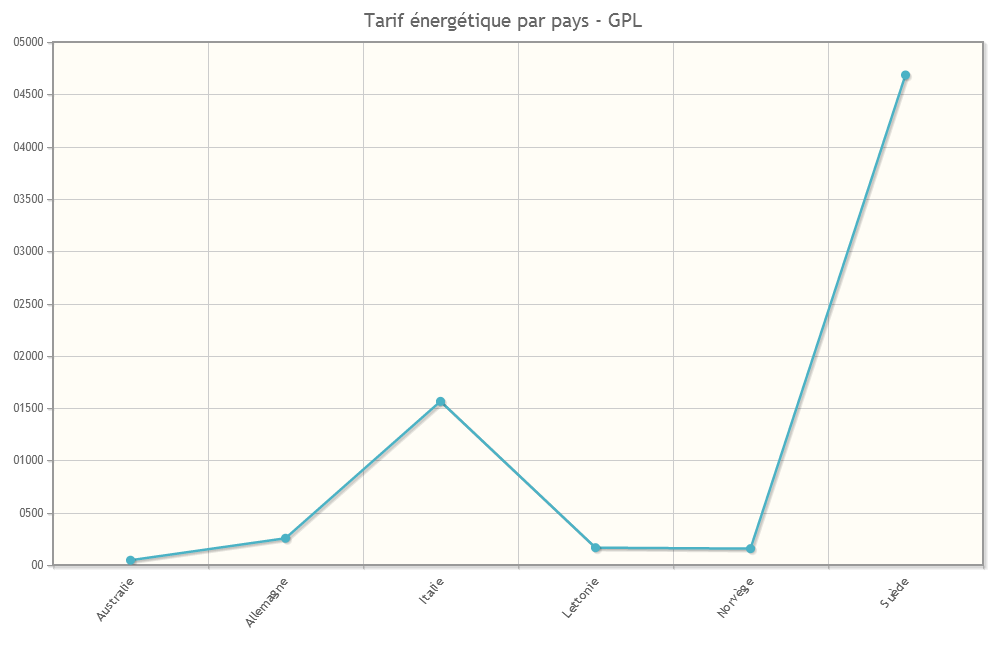
Energy costs by country – GPL
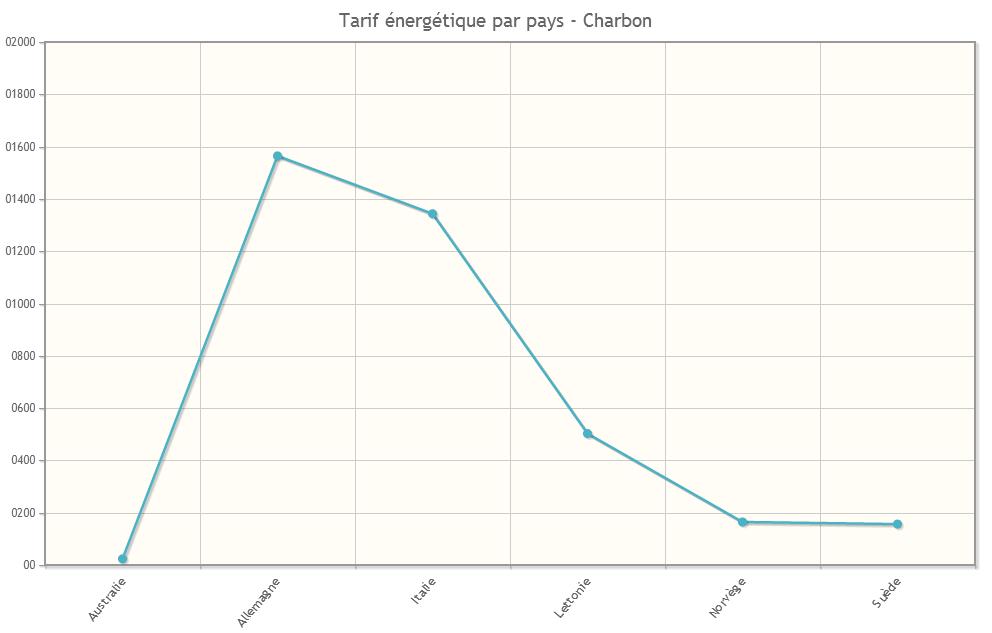
Energy costs by country – Coal
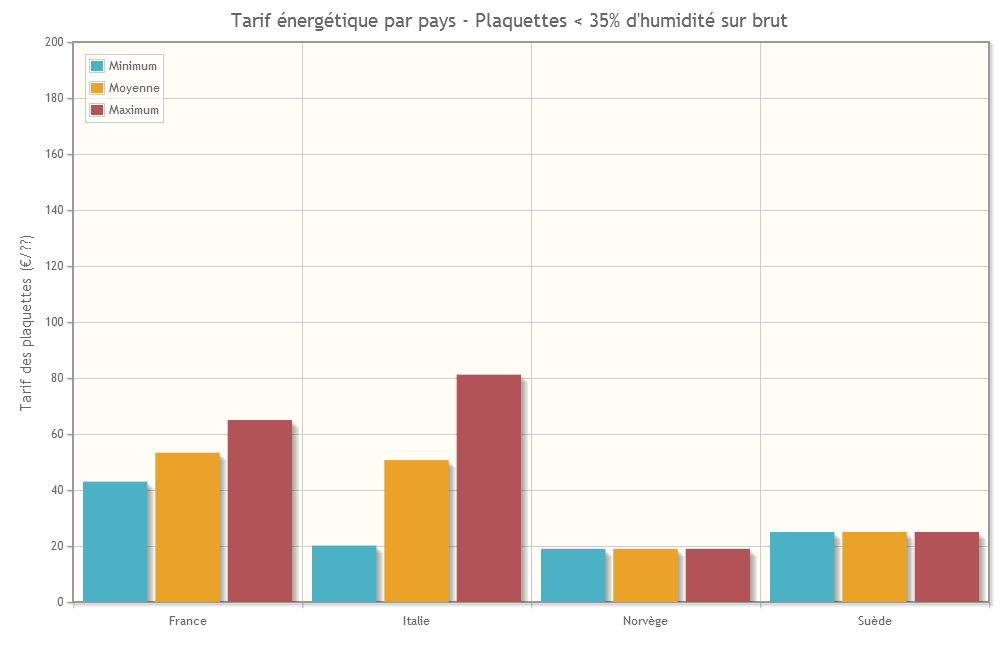
Energy costs by country – wood chips < 35% of moisture
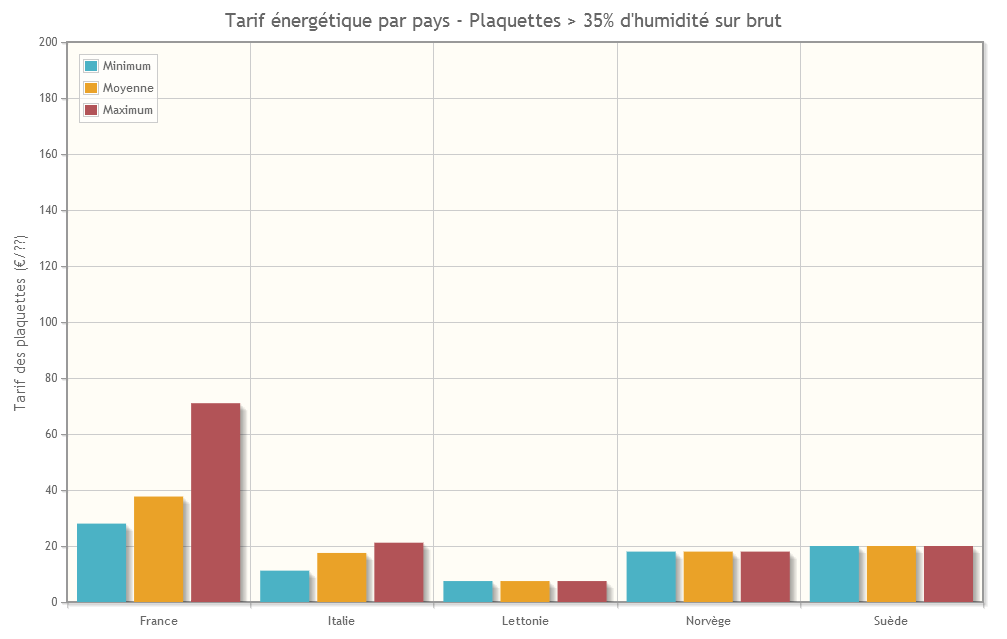
Energy costs by country – wood chips > 35% of moisture
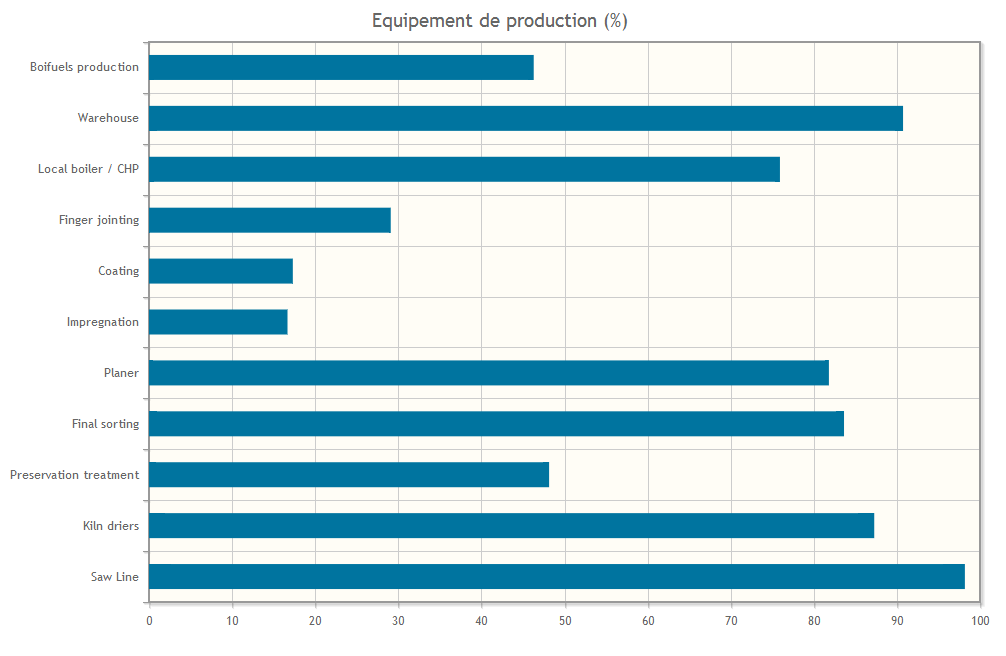
Sub-processes (%)
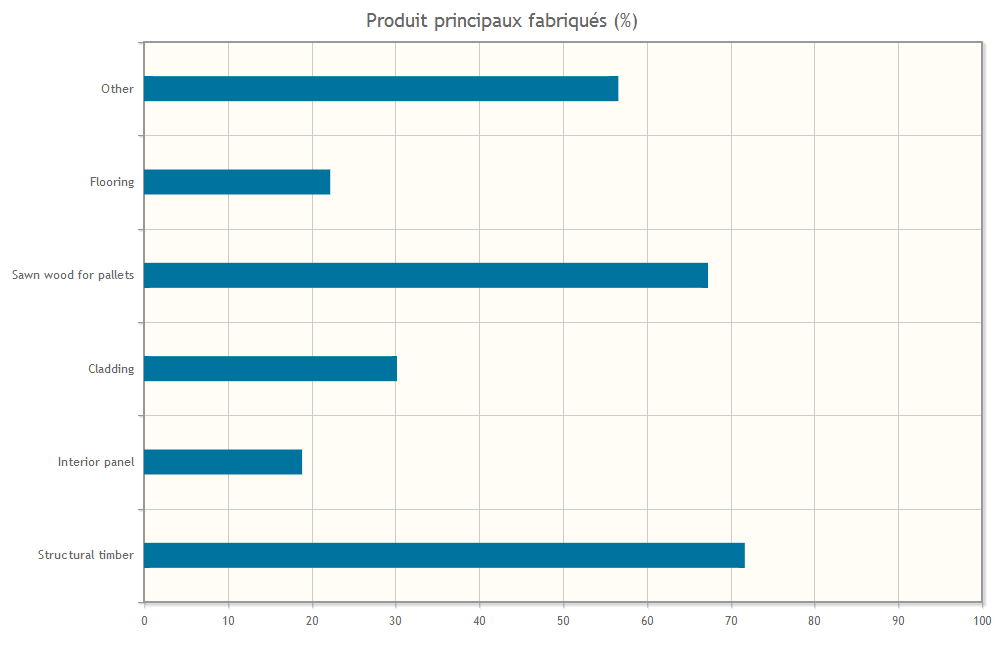
Primary products (%)
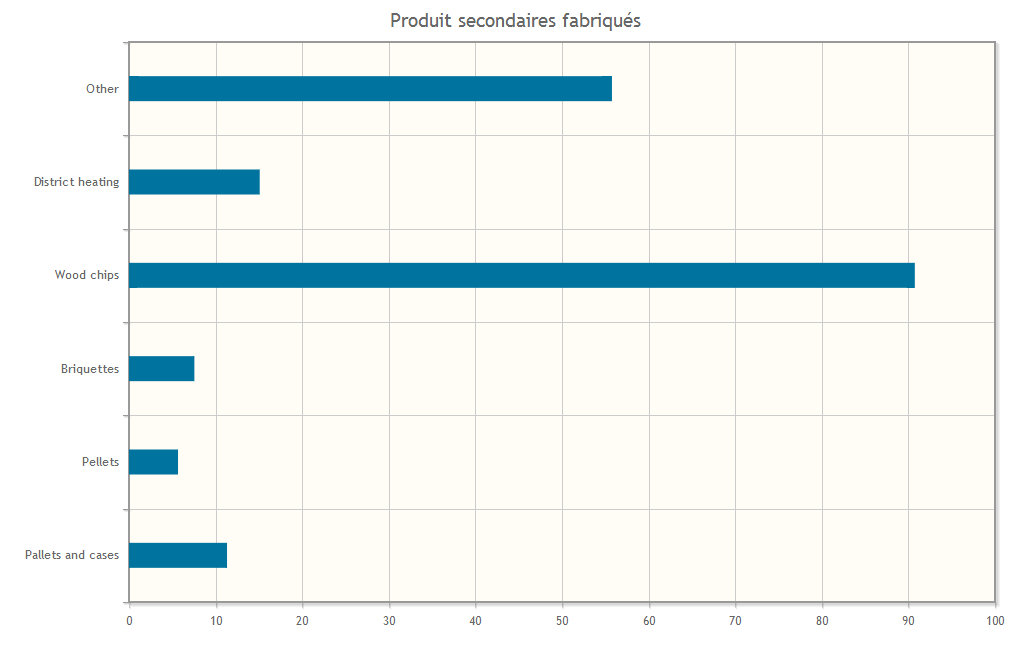
Secondary products